YouTube Analytics – A to Z guides for creators to analyze video-posting tactics
Contents
YouTube does provide channel administrators with a tool to track and analyze channel performance – the YouTube Analytics tools in Creator Studio. If you are a creator but have not used this tool yet, it is a huge omission and disadvantage for you, especially while you’re trying to have 4000 watch hoursmake money on YouTube.
Through YouTube Analytics tools, you can easily know who is watching your videos, where they are coming from, the number of views and subscribers, and so forth.
These essential data and statistics can be seen as the strong foundation for you to figure out what to focus on, who the potential audiences are, what problem with your content to solve, or how to attract more viewers.
Thus, to acknowledge more about the tool’s functionality, here is an A to Z guideline for you.
Read more: Buy YouTube Watch Hours Legit For Monetization
How to check YouTube Analytics?
YouTube Analytics tool gives you indeed valuable data, but you can get overwhelmed if you see all of those numbers at once.
First off, follow these steps to check your video’s performance briefly to grasp an overviews:
- Login into your YouTube account first.
- Click on your profile icon and choose “YouTube Studio”.
- Select Analytics from the left-handed menu and take a look at the statistics, such as Overview, Reach, Engagement and so on.
- Click on Advanced Mode to see a more detailed breakdown of channel analytics.
- Click on Compare To in the upper right corner if you want to make some comparisons between the current channel’s growth and that of previous years (if needed).
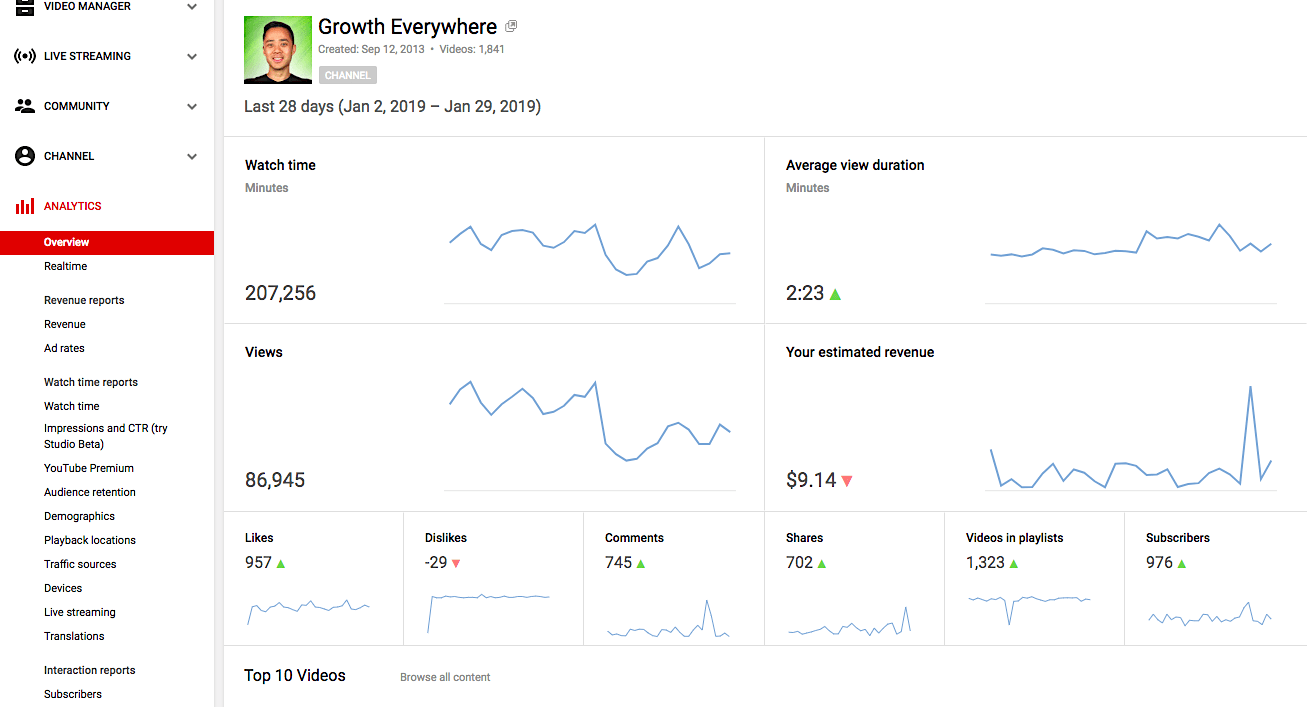
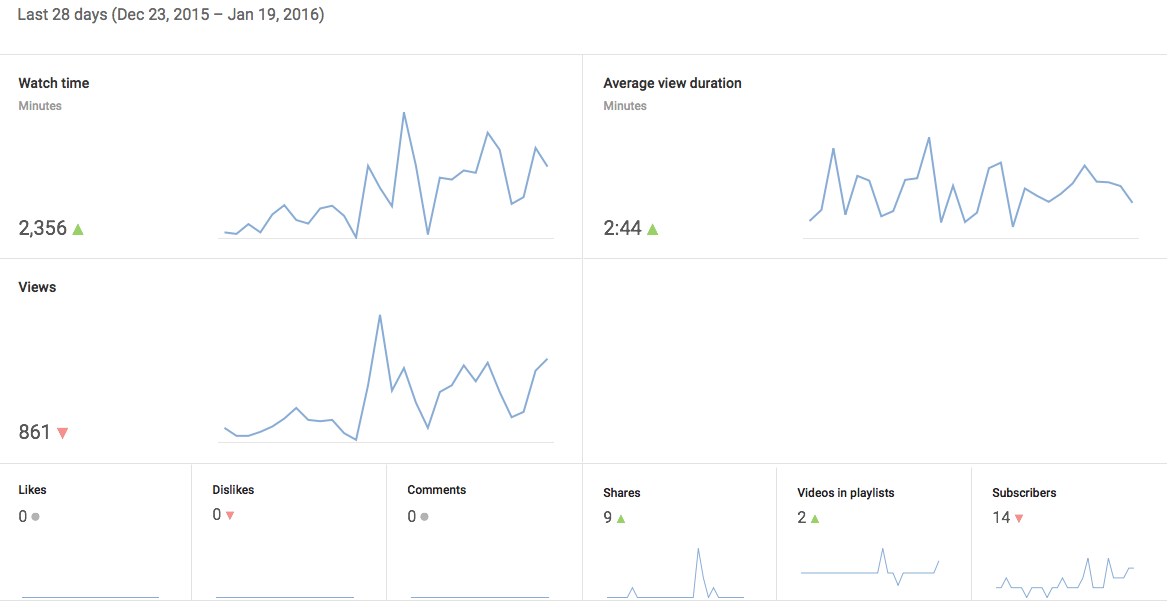
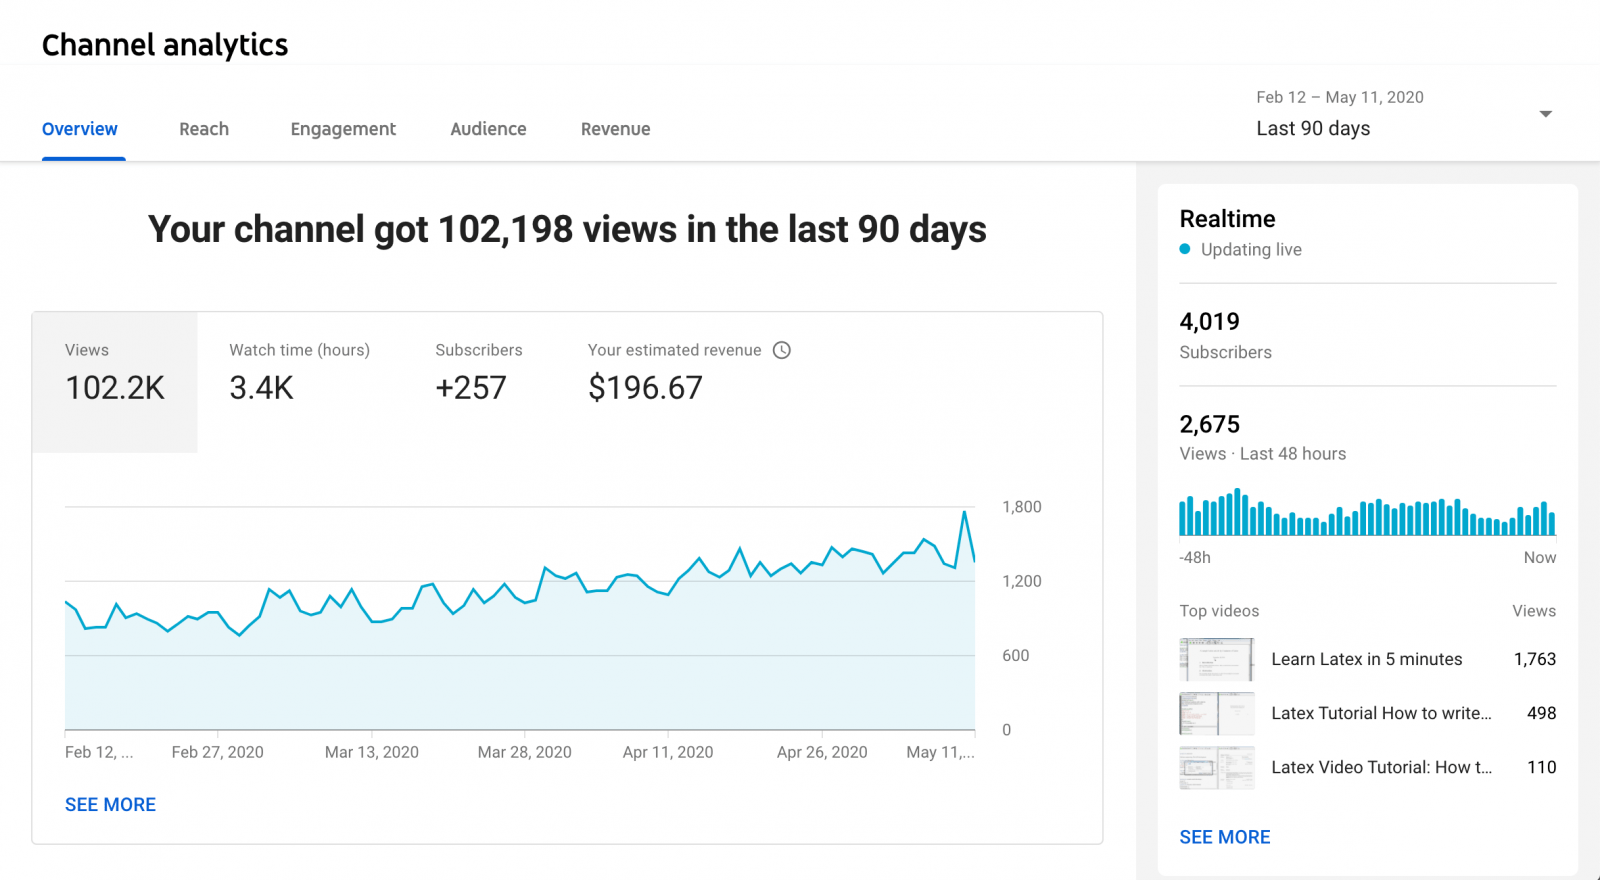
Overview of channel’s performance
On the “Overview” tabs, you can check the watch time, the number of views, and subscribers of your channel.
Engagement Report
For more information on watch time, click on “Engagement” to see the watch time (in minutes) and the average watch time of your channel.
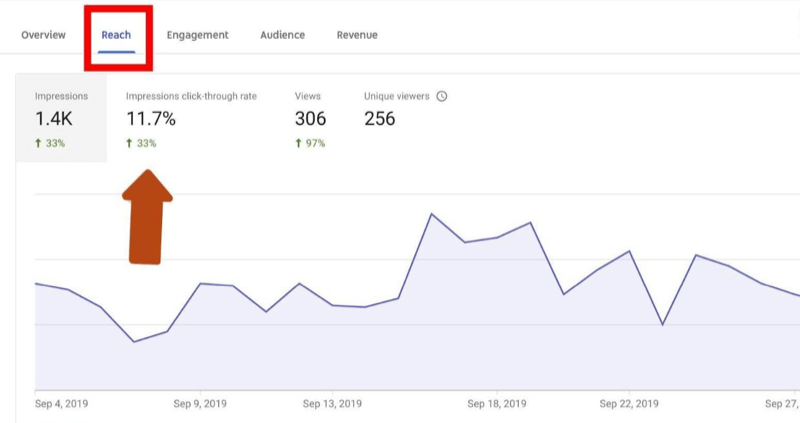
Reach Tab
In the “Reach” tab, you can see how many audiences share your video.
Important metrics on YouTube channel Analytics
Well, we’ve put together the most essential and impactful YouTube analytics metrics on your channel’s development, as a result, deliver value to your subscribers and keep them engaged.
Watch time: the key YouTube analytics tactic
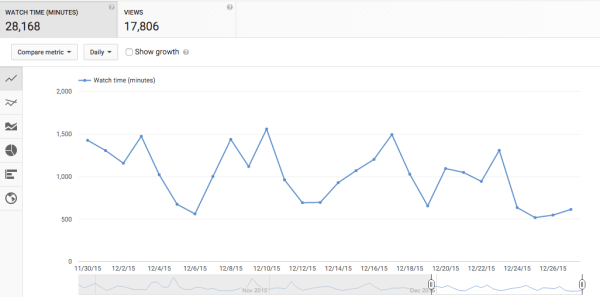
Watch time to track the gained watch hours
As an impressive tool, watch time reports provides a good way to check the average number of minutes which a visitor spends watching your videos. It’s super significant since YouTube depends on it to measure and predict the performance of your channel and videos.
The longer a viewer watches your videos, the more YouTube will recommend and rank your videos high search page. YouTube’s algorithm values videos with longer watch hours because it means people are spending more time browsing and viewing on this platform.
You can use this report to see the total watch time you’ve accrued since the beginning of your YouTube channel.
Tips for increasing your YouTube watch time
- Capture viewers’ attention in the first 5-10 seconds by a sharp and compelling intro.
- Long videos may not help you increase the watch hours of your audiences.
- Create content worth watching for your fan.
- Add a great trailer on your YouTube homepage.
In addition, watch time is necessary for making money from your videos. You need to find out carefully about YouTube Monetization Policies, and how YouTube works. That information will help you know how to attain 4000 watch hours and join the YouTube Partner Program (YPP) for getting monetized.
Read more: Buy a monetized YouTube channel
Average viewing time
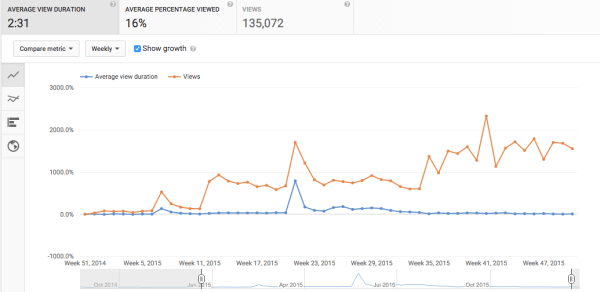
Average viewing duration
The total time a viewer watches your video divided by the total number of video playback is the average viewing time.
This report helps you see how your videos interact with your viewers. The less engagement your video is with your audience, the less average watch time and watch time will be. Average watch duration also affects your ratings and video recommendation on the search result.
Impression
Basically, impression is a statistical indicator of how often an ad is viewed by visitors without having to click on the ad. This figure is determined by the number of ads displayed on a Google search engine or other Internet sites.
Impression metric on Youtube
An impression is an estimate of how many people a particular ad is reaching and can be calculated differently depending on how the ad is placed on the page.
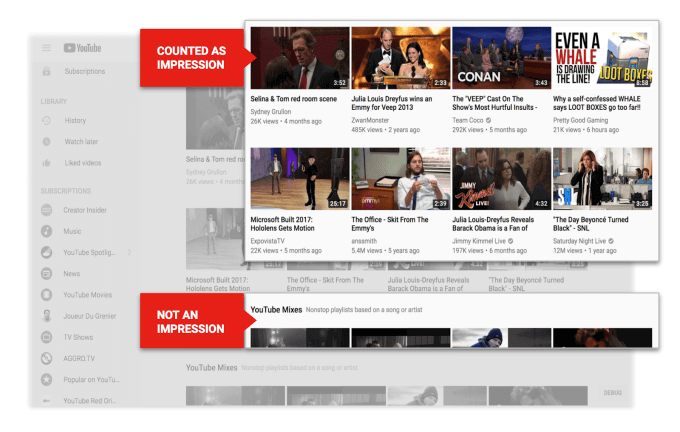
On the YouTube homepage, every time a viewer sees your video thumbnail on the platform, that’s called an impression, which means the number of times the video thumbnail shows up on YouTube. Per impression can be considered as a potential reach on YouTube and an opportunity to increase more views.
Besides, not only on homepage, if one video appears in search results, watch history of a trending page, subscription fees, video playlists, recommendations, that’s an Impression.
It can be admitted that all other important metrics of Youtube Analytics are derived from impression. Every time that your video is displayed on any position on Youtube, you get free advertising for your content.
In other words, every time a video’s title and thumbnail appears by targeting a potential viewer, they could click on it and watch that video.
So to look at your channel analytics, Impression specifically, click on your channel icon on the top right hand corner then choose Creator Studio. After that, down the left hand side you can see Analytics, click on it and it will show you your Youtube channel analytics.
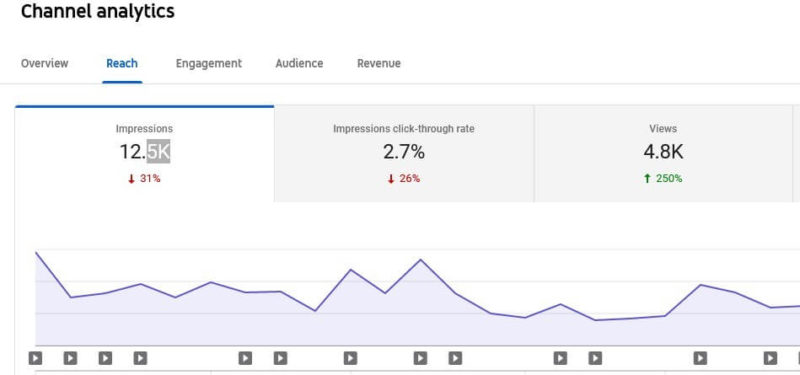
Reach viewer tab
In the toolbar at the top, select Reach Viewers then you can see a breakdown of your video’s impressions over the last 28 days of your channel.
To see the impression data of each video, go to Overview and there’s a list of your top performing videos and you can see a rundown of individual impressions for different videos.
CTR – Click-through rate
CTR, which stands for Click-Through Rate, is the percentage of people who click on a particular link that appears in front of their eyes. For an ad campaign, CTR is the ratio of the clicks your ad or link received divided by the number of times your ad or link was shown.
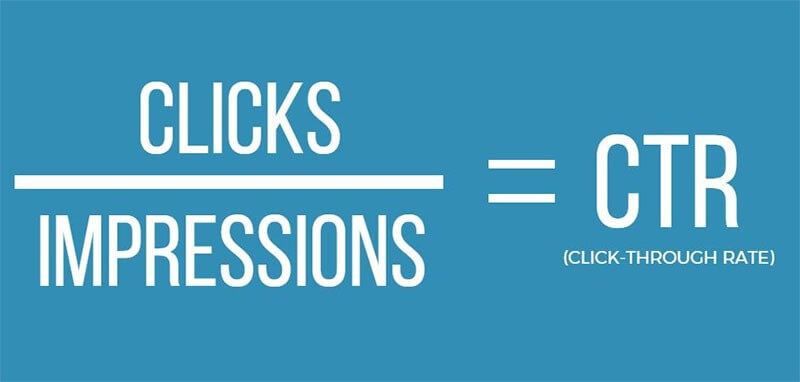
Click-Through Rate
In other words, if a user sees your videos on Youtube and clicks on them to watch, an impression has converted into a click or view. For example, if one of your videos has 10,000,000 impressions and 100,000 views, hence the CTR will be 1%.
You will find your CTR right next to Impressions of Tab Reach Viewers in Analytics. If you tap on the box, you will see the graph changes to represent what your CTR is.
According to YouTube itself, half of all channels and videos have an impressions CTR ranging between 2-10%. Today, creators focus more on this statistic to effectively optimize their video promotion strategy.
Impressions click-through rate will vary depending on the type of content, viewers and placement of the video on YouTube. In general, the best way to get more impressions is to consistently create great quality content that viewers love.
In short, CTR is directly proportional to the number of views of the video. This metric scores your titles and thumbnails to see if they are compelling, appealing, and enticing enough to grab their attention. You can be confident that your content is unique and awesome. However, if you don’t convince your viewers about the quality of the content through these “impressions,” everything might go down the drain.
From there, you miss out on opportunities to increase views, as well as hinder the improvement of other critical metrics and negatively affect video performance.
Read more: Research from experts – How does monetization work on YouTube
Audience Retention: YouTube analytics data for tracking audience’s behavior of viewing
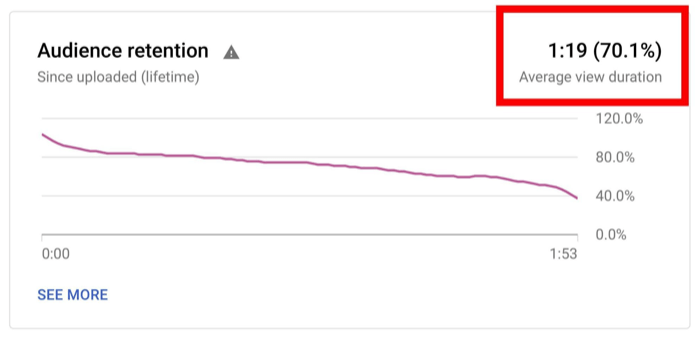
The rate of Audience Retention
If you want to know the proportion of visitors who watched and quit the video at a given moment, Audience Retention (AR) can give you clear information. You can leverage your audience retention report for future video strategies. Specifically, with this report, you can know:
- Top videos or channels listed by watch time.
- Average watch duration for all videos on your channel.
- Relative audience retention of a video compared to the average of similar videos on YouTube.
- Data holds viewers of a particular video over different time frames.
As a consequence, you can use the most engaging parts of your video to generate new video topic ideas, and use the least engaging parts of the video as a signal to stop creating content around those topics.
Videos with a high retention rate are often prioritized by YouTube to rank in the search engine and to put in video recommendation as it has been shown to attract viewers’ attention.
On top of that, bear in mind these two indexes.
Absolute audience retention rate
This indicator shows which exact moments in your video are most viewed, as well as where people tend to drop off. So, this kind of connection will give you better ideas of what your audiences want to watch, and provide you with necessary adjustments when viewers quit watching.
Relative audience retention rate
This points out your audience’s tendency of viewing compared to that of other channels, and also, where you compare your video retention with all other YouTube videos of similar length.
This index is only based on duration, which is not the only factor evaluating the content. Nevertheless, it does provide a relevant comparison between your content and those of other YouTube channels.
Real-time report
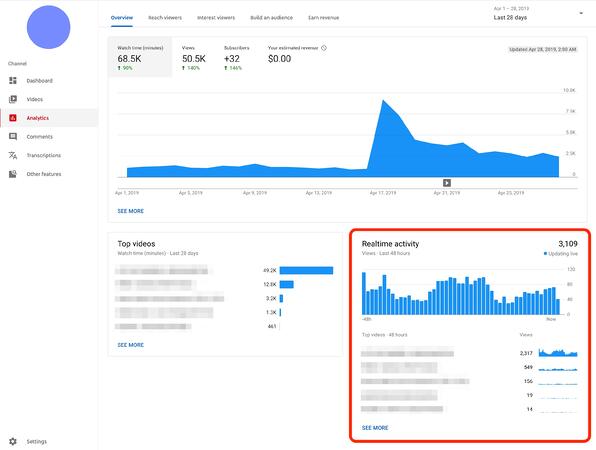
Channel’s real-time activity
This report shows total views for all videos on your YouTube channel and gives you insight into your most recently published videos. This comes in handy if you are looking to push your promotional strategy. You can also view this data in reports for each video as well.
Demographics
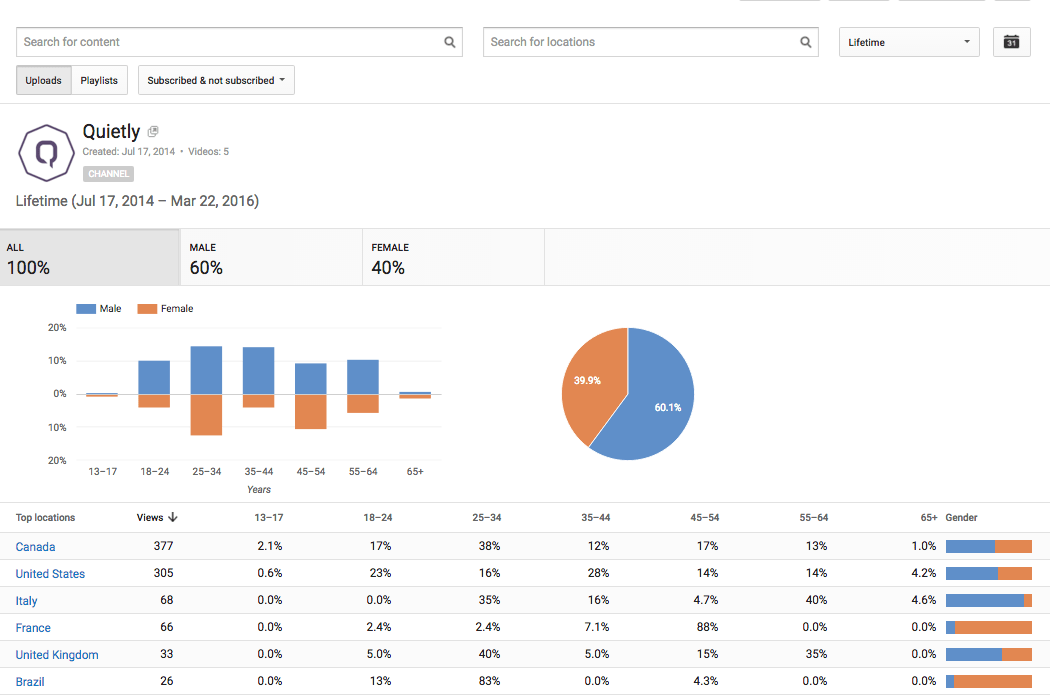
Demographics of YouTube channels
There are so many things you can do if you know who your audience is. Therefore, you should look at the “Demographics” report. So you can find out the age, gender, and nationality of the people watching your video.
Therefore, this will give you a better understanding of the type of content and topics you can focus on and tailor it to your audience to increase watch hours.
Location
To see the number of viewers watching your videos locally or internationally, as a result, “location” helps you with video promotion campaigns, marketing products, and services as well.
Age and gender
This data helps you to classify your content to a certain age group. For example with the game review niche, game-related videos containing violent elements need to be considered. You should set an age restriction when posting those videos on your YouTube channel.
Armed with this knowledge, you can tailor the audio of your video to regain your intended demographic, swing around for your newly discovered audience, or find a way to please everyone.
Times and Days
It’s good for you to establish an uploading-time-frame schedule to attract the most number of views and audiences.
Read more: How to optimize your YouTube channel? (Part 1)
Playback locations
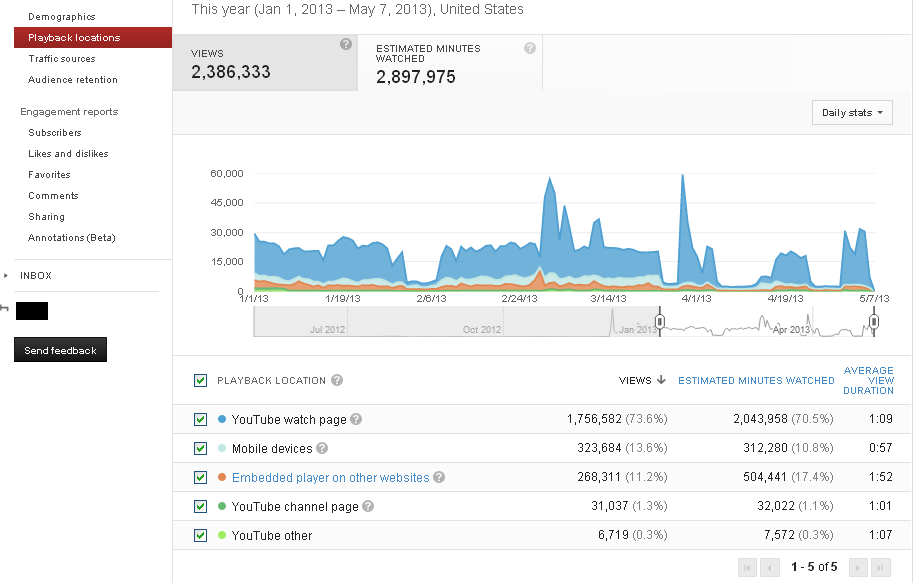
YouTube playback locations
“Playback locations” lets you know more about where your videos are being played, on the YouTube platform or other websites. You also have a deeper insight into your audience browsing and tracking behavior. It can even open up opportunities for new marketing partnerships.
Device
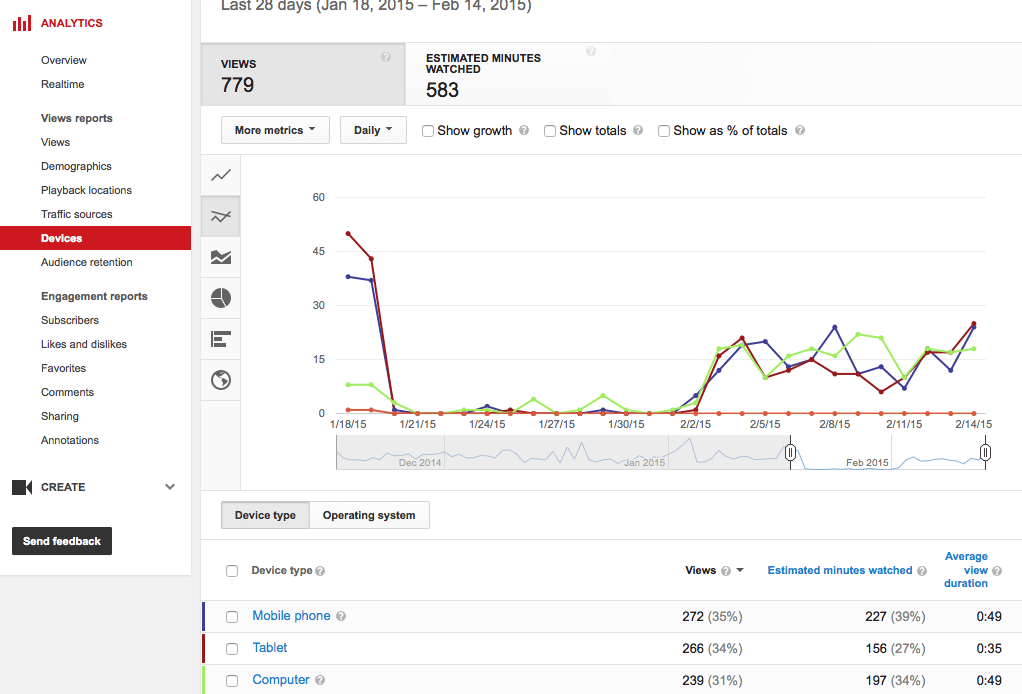
Devices – which devices people use to watch YouTube?
This indicator consists of the percentages of the audience viewing your content on PC, mobile phones, tablets, game consoles, or smart TVs.
Devices affect the types of content people watch on YouTube, as well as how they interact online in general.
Traffic source
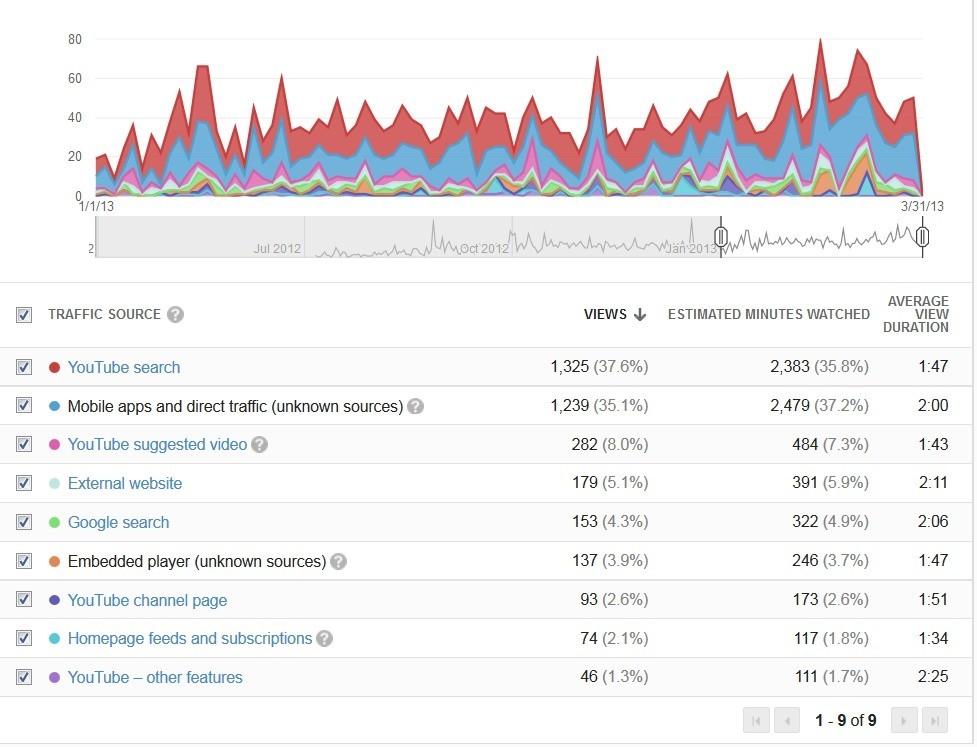
Traffic sources data
Every creator needs to know where their traffic is coming from. External referral and internal referral sources also are their concerns.
This allows you to find the best platforms for promoting your videos. For instance, if you see most of your traffic coming from your Pinterest page, then, incorporating your YouTube video’s link could draw more attention then increase more potential audiences.
Your YouTube traffic source report shows how visitors found your video content and which sources help increase your watch hours, views, and subscribers. Therefore, adding Google Analytics would be a great addition to have more detailed information.
Likes/Dislikes
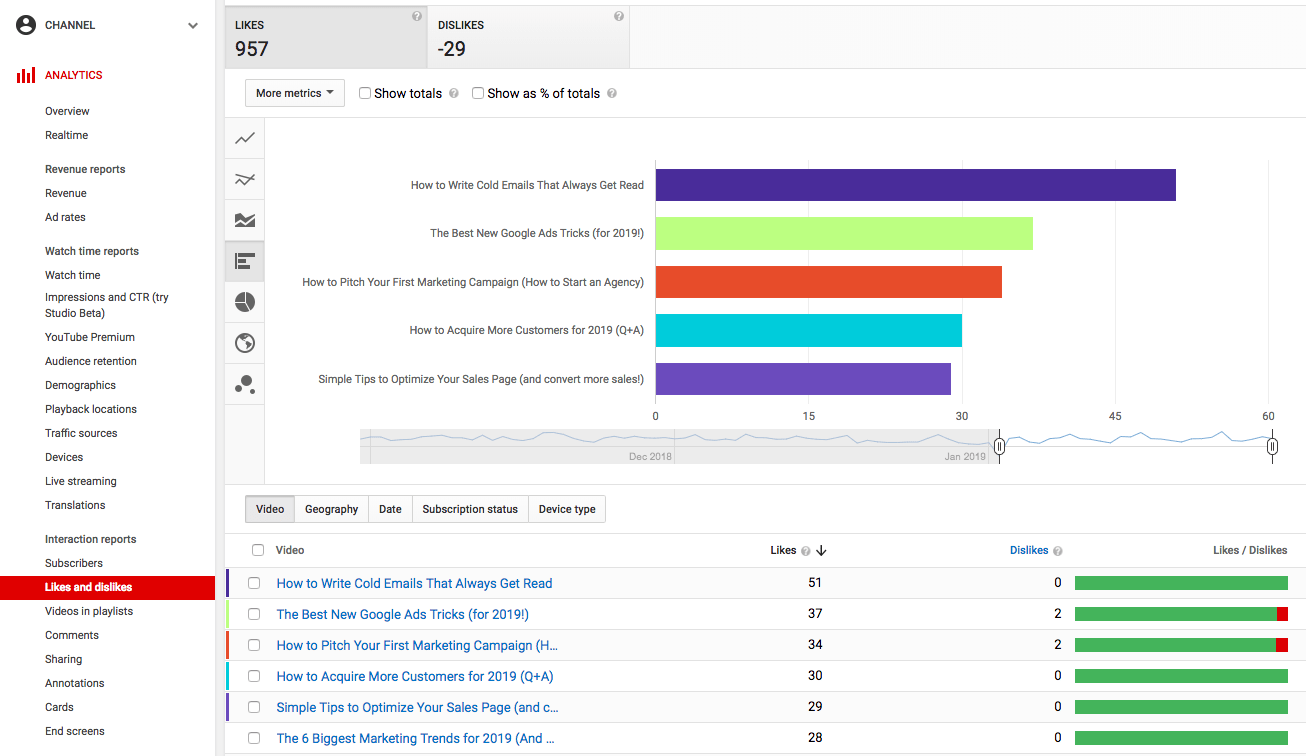
Likes and Dislikes
Very simple, this metric reflects the audience’s point of view on what you do, whether they like it or dislike it.
From there, you can understand the viewer’s opinions when reviewing each of your videos. More importantly, you’ll know whether they like the videos themselves or the particular subjects.
On the other hand, if you get a significant amount of dislikes, reconsider the content type or how you convey it. Is such content too controversial or irrelevant to your target audience? Are titles and thumbnails related to the content already?
Subscribers rate
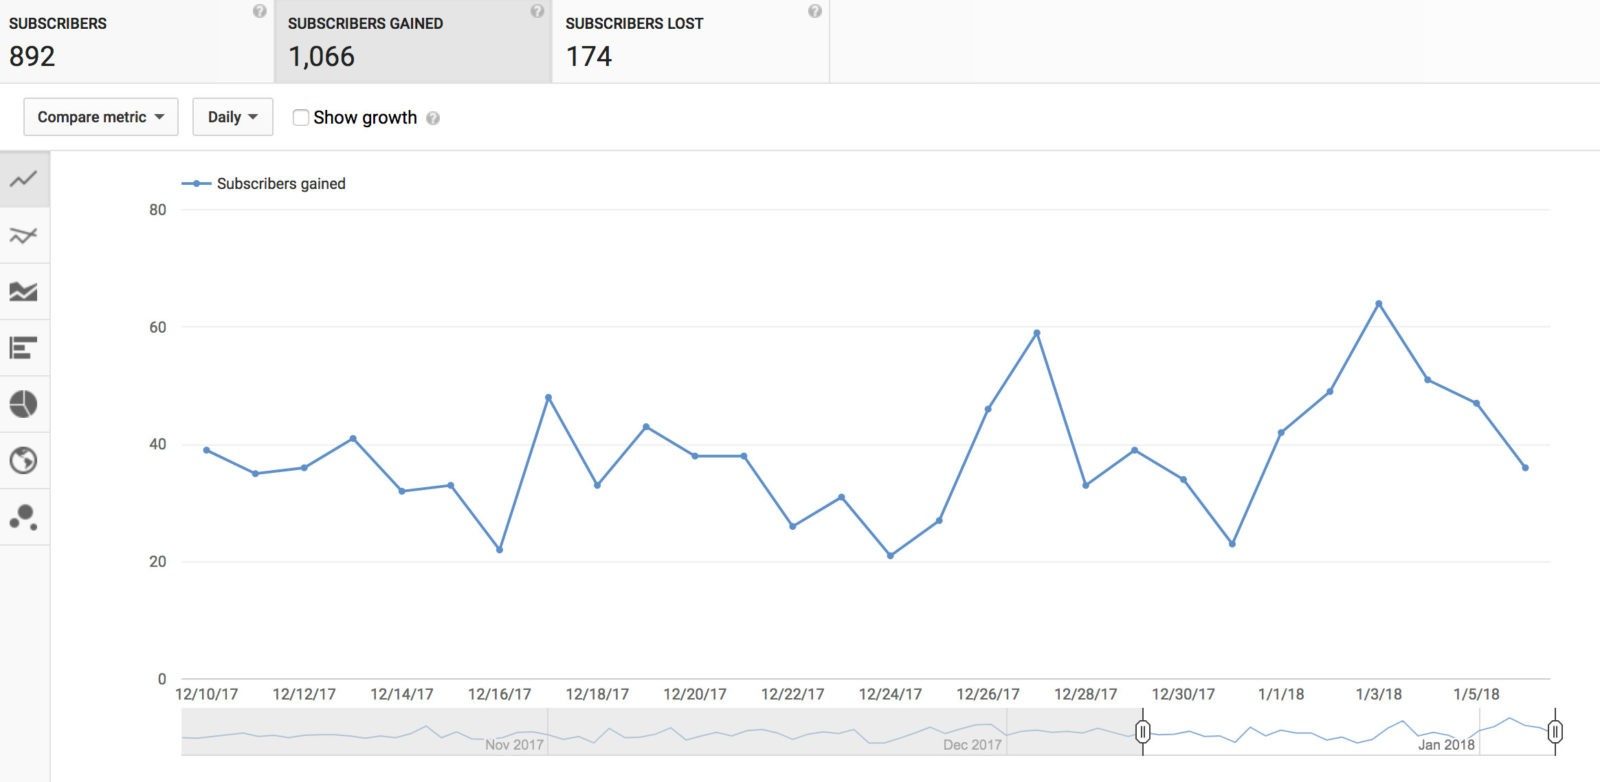
Subscribers rate
Considering subscriber growth helps you measure your efforts to develop a better YouTube channel. Indeed, your subscribers are the most loyal fans when it comes to your overall content.
Without these loyal audiences, you won’t have anyone watching your videos on a regular basis. Besides, the YouTube subscribers report also lets you know which videos and when you lost or gained subscribers.
Understanding the YouTube Creator Studio Analytics
The YouTube analytics tab on the Creator Studio is the best source on engagement metrics for beginners.
The analytics tab is perhaps the most exciting tab on the YouTube Creator Studio. This allows creators to view and monitor their channel’s interactivity and engagement over time and per video. Moreover, the analytics tab comprises four sections with several different tools and exciting features. These four sections include:
- Overview
- Reach
- Engagement
- Audience
We have outlined these four sections of the YouTube analytics tab in the following four parts of this section of the article.
YouTube Analytics Overview
The overview section of the YouTube analytics tab gives you a summary of your channel analytics over the last 28-30 days. This includes a graph of views, watch time, and hours in the previous 28 days. This part also features a ‘SEE MORE’ button that allows creators to view a more detailed summary of their YouTube channel analytics. Creators can factor for various demographics and elements such as:
- Video
- Traffic source
- Geography
- Viewer age
- Viewer gender
- Date
- Playlist
- Device type
- YouTube product
- Video type
- Playback location
- Operating system
- Subtitles and CC
- Video info language
- Translation use
- End screen element type
- End screen element
- Card type
- Card
- Sharing device
Moreover, you can also change the period for the graphs. Additionally, the overview section also enables creators to view their videos per watch time, subscribers, views, impressions, and impressions click-through rate.
Reach
The reach section of the YouTube analytics tab on the Creator Studio shows graphs for four major engagement types:
- Impressions
- Impressions click-through rate
- Views
- Unique viewers
Additionally, the reach section also features traffic source types for your channel. It gives you a summary of your traffic sources for the last 28-30 days. Additionally, you can also see your primary external traffic sources and views from those sources and through YouTube searches and playlists.
Furthermore, the section also features a pyramid diagram on impressions for your channel for the last 28 days to show how impressions lead to watch time. This is an excellent source for understanding how channel analytics work, especially for beginners.
YouTube Engagement Analytics
The engagement section of the YouTube analytics tab shows creators graphs for their watch time and average view duration for the last 28-30 days. Moreover, the section also features critical moments for audience retention from your videos from the previous 365 days.
Additionally, the section allows creators to view their top videos, top playlists, top cards, top videos by end screen, and top-end screen element types.
Audience
Finally, the audience section of the YouTube analytics tab shows creators graphs of their channel analytics based on returning viewers, unique viewers, and subscribers. The section also tells you when your viewers are usually online based on time zone. It also gives you a summary of your total watch time from subscribers in the previous 30 days.
Additionally, creators can also view their audience’s demographic summaries. This includes summaries of their age and gender. Moreover, one can also view other videos your audience watched, leading geographies and top subtitle/CC languages for your videos.
Related articles:
- How to get 1000 subscribers on YouTube
- 10 tips to increase Youtube subscribers – legal, safe and stable for a long run!
Want to know more about other tactics for YouTube channel development?
In a nutshell, YouTube analytics seem to be the most powerful tool to help you get used to how the YouTube algorithm works. As a consequence, you can create content that attracts viewers to ensure the long-term development of the channel.
Thus, you can sign up for AudienceGain right now for more updates from our service and other valuable information for making money from this platform itself.
How to make fake Instagram followers? An easy way to increase IG FL
How to make fake Instagram followers? Generating fake followers is a great way to boost your online presence. Users who do not follow your account...
How to grow Instagram followers organically? 8 Way to grow your ig followers
How to grow Instagram followers organically? Instagram has a highly sophisticated algorithm that decides what posts are shown to which users. This is an algorithm...
How do you get 10k followers on Instagram? Do I get 10000 IG FL?
How do you get 10k followers on Instagram? Hitting the 10,000 followers mark on Instagram is an exciting milestone. Not only will having 10k followers...
Calantha
17 April 2023


You must be logged in to post a comment Login